The story
Hydro-Québec publishes a live outage map: what is broken now, and when they expect it back. Then it forgets. No history, no accuracy record, no way to ask whether last Tuesday’s estimate meant anything.
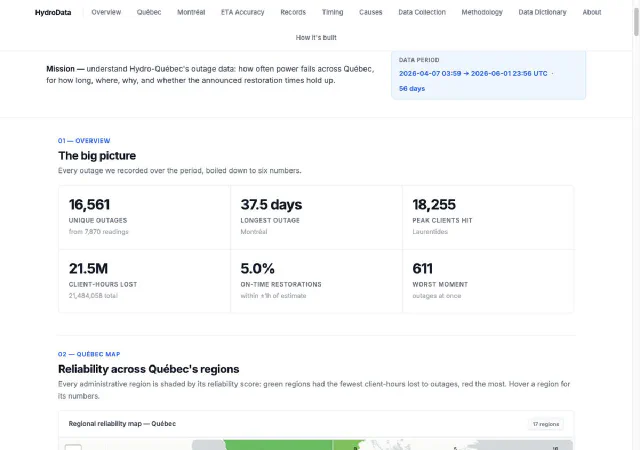
I wanted one number. When they say the power is back at four, how often is it back at four? Nobody publishes that, so I wrote the map down every minute for fifty-six days and worked it out.
It is right about five percent of the time. The second thing I noticed was that I estimate exactly the same way.
The product
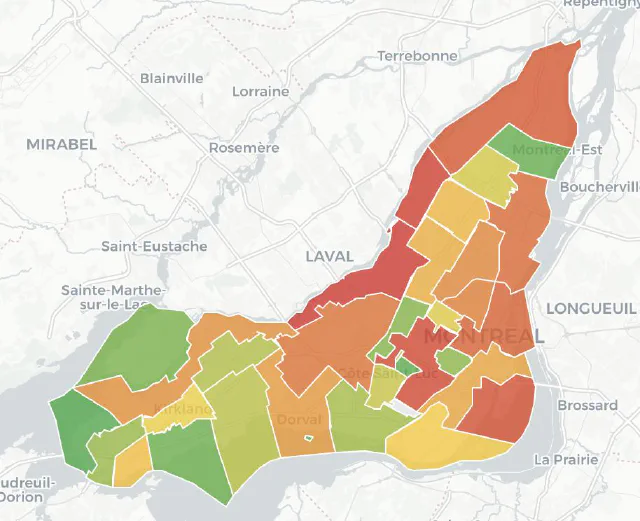
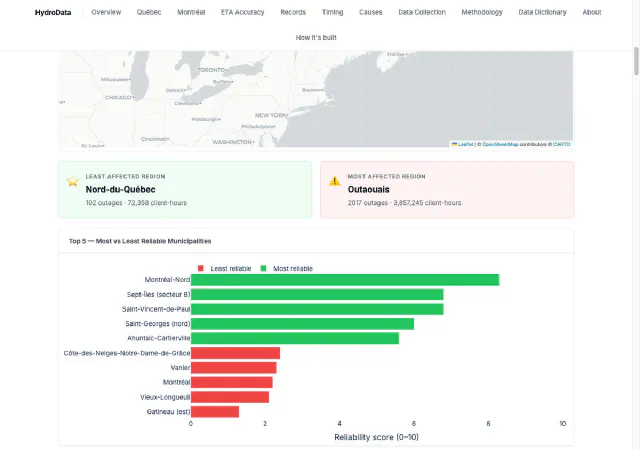
A reliability report the utility does not produce: where outages concentrate, how long they really last, which causes dominate, and how far the published estimates fall from what happened. The Montréal borough map exists because the raw feed ships geometry meant for drawing, not for counting, and turning polygons into per-municipality attribution was most of the work.
The collector is deliberately dull. Snapshots append to the open hour’s file and only closed hours upload, so it can die at any moment and lose at most one minute — which it did, more than once, over eight weeks.
I started polling before I knew the question. Every result worth having came from something I could not have thought to ask on day one, and could only ask because the data was already on disk.