The story
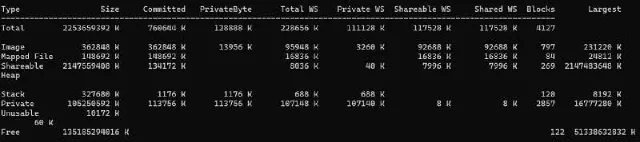
A process was running out of virtual memory in production, and Task Manager had one number for it. One number can’t tell you whether the heap is fragmenting, whether a mapped file is never being released, or whether a DLL’s private pages are growing on every load. VMMap from Sysinternals can show you all of that, but only as a snapshot you take by hand, in a window, on the machine.
I wanted the same detail over time, from inside my own process.
The product
You link the library, hand it a process id, and call it when it matters:
CSnapshotMngr tracer(processId);
tracer.PrintNow();          // one snapshot to the console
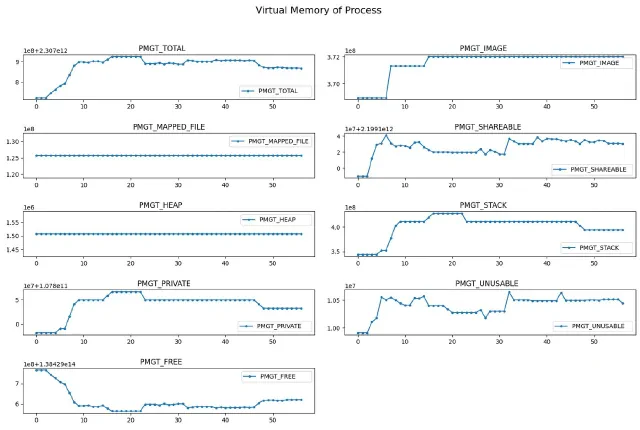
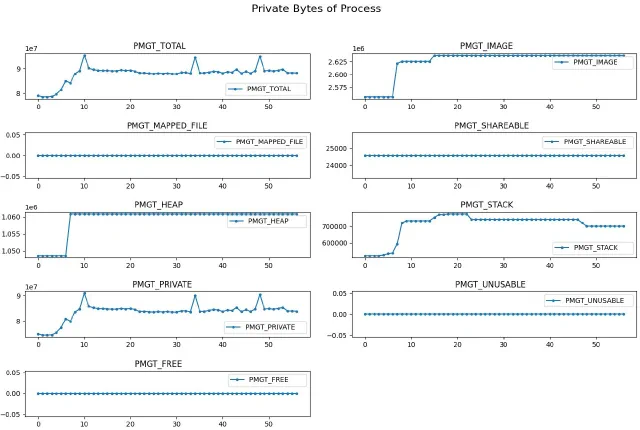
tracer.Export(120, 2);      // every 2s for 120s, to CSV
You plot the files it writes. It reads the Windows memory APIs directly (VirtualQuery, the
Tool Help API, section objects) rather than calling an external tool, so it can run
inside the process being measured.
It grew out of a VMMap reimplementation that I fixed and extended: a private-bytes counter it didn’t have, CSV export, and control over when snapshots start.