If you don’t want to be embarrassed due to your program running out of virtual memory — which could cause many passengers to miss their flights — perhaps you should take a 5-minute break and read this article on how Windows manages virtual memory for processes, and the tools you can use to monitor it.

Running out of virtual memory is not always a quiet failure.
Before reading this article, I strongly recommend reading the first article that discusses the basics of Windows virtual memory management: Windows Memory Management: Virtual vs Physical, and How to Measure It.
I need to mention again that this is a very complex subject, extending even beyond my knowledge. For those who are curious and want to understand every bit, I recommend reading the book Windows Internals by Mark Russinovich.
When you use the VMMap tool from Windows Sysinternals, you can take a snapshot that shows the usage of virtual memory within a process to a fine level of detail:
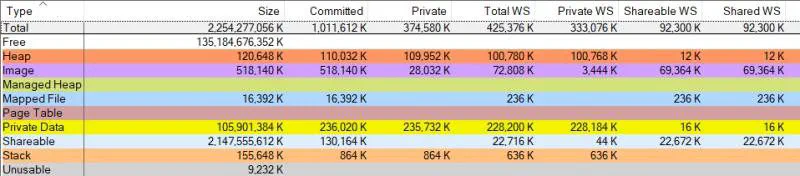
Windows VMMap snapshot.
Let’s refer to each column as a memory state and each row as a memory type. In this article, I will first provide a brief introduction to the different memory states, and then I will explain each memory type in detail with examples.
Memory states
Each page in a process virtual address space can be in different states. Let’s try to define each one of them briefly:
- Size, Reserved — total amount of memory reserved by the memory manager for the process.
- Committed — reserved memory that is actually in use, and when accessed, ultimately translates to valid pages in physical memory (either RAM or the paging file).
- Private — committed memory that is private, meaning it is only used by the owner process. This is what we refer to when we talk about private bytes.
- Total Workspace (WS) — committed memory that is in physical RAM.
- Private WS — memory that is in RAM and only used by the owner process. In Windows each process has its own private working set.
- Shareable WS — memory that is in RAM and can be shared between processes.
- Shared WS — memory that is in RAM and currently being shared between processes.
Note that memory that is committed but not in the working set means that it is in the paging file (on disk), and the Memory Manager will copy it into RAM if a process needs it.
Memory types
Each row of the VMMap snapshot above is a type of memory. The rest of this article takes them one at a time: what each one represents, and how it gets allocated.
1 — Private data
We start with private data because it is the memory allocated and used only by the owner process and cannot be shared between processes. It is also the main reason for most memory leaks and fragmentation. You can allocate it using the VirtualAlloc API, which is the lowest-level memory allocation API available with the Windows Memory Manager.
In this example, we demonstrate how to use the VirtualAlloc function to reserve
and commit memory:
// Example 1 : Allocate memory without specifying the base address
LPVOID MemPtr1 = VirtualAlloc(NULL, size, MEM_RESERVE | MEM_COMMIT, PAGE_READWRITE);

// Example 2 : Allocate memory at the specified address
LPVOID desiredAddress = (LPVOID)0x00400000;
LPVOID MemPtr2 = VirtualAlloc(desiredAddress, size, MEM_COMMIT | MEM_RESERVE, PAGE_READWRITE);
The first parameter of the VirtualAlloc function is the base address of the
memory block you want to allocate, and NULL means that the Memory Manager will
decide. Choosing the address yourself is occasionally what you want, and
usually not — the Memory Manager has more information about the address space
than you do.
Important notes about VirtualAlloc:
- If you try to reserve memory that is already reserved, the operation will fail.
- If you try to use memory that is reserved but not committed, the operation will also fail.
- Allocated memory is always initialized with 0 for Windows security reasons. A snapshot from Visual Studio confirms that.
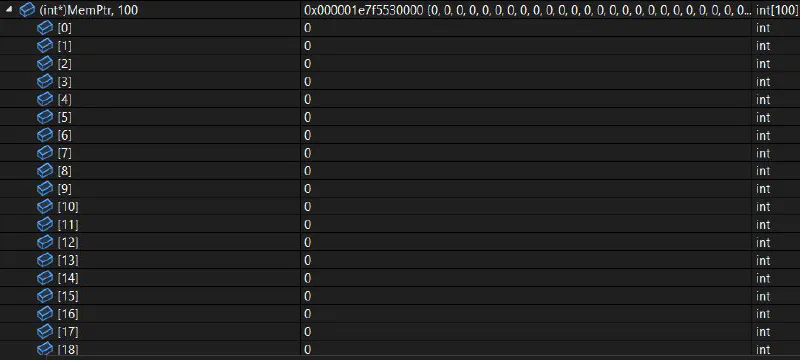
Allocated memory using the VirtualAlloc function is always initialized.
Committing memory does not necessarily mean that it is actually in RAM. Committed memory means that Windows guarantees it will be able to provide you with RAM when needed. You can force the Memory Manager to allocate RAM by using the memory (touching it), as demonstrated in this example:
// 1
for (int i = 0; i < 100; i++)
    *((int*)(MemPtr) + i) = i;

// 2
for (int i = 0; i < 100000000; i++)
    *((int*)(MemPtr) + i) = i;

// 3
for (int i = 0; i < 200000000; i++)
    *((int*)(MemPtr) + i) = i;
After each for loop (1, 2, and 3), we observe the growth of the working set —
and consequently the used RAM — of the process each time we access more memory.
It’s important to note that the reserved and committed memory do not change by
only using memory, because the memory was allocated and committed in advance.
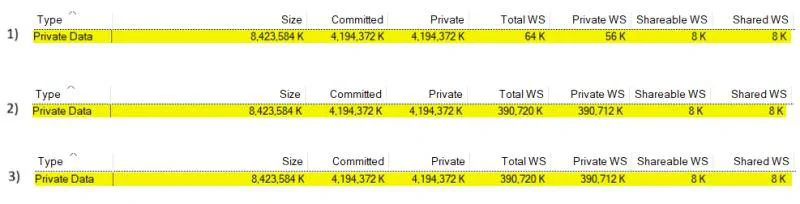
The process working set grows when memory is used.
Query private memory. You can determine if a specific address is private by
using the VirtualQuery function and checking if the data member type of the
output structure MEMORY_BASIC_INFORMATION is equal to MEM_PRIVATE.
Code available on GitHub: https://github.com/brmel/MemoryTracer
2 — Stack
The stack is a special private memory allocated by the Memory Manager for each thread, used to store function parameters, local variables, and so on.
When a thread is created, the memory manager automatically reserves a predetermined amount of virtual memory, typically 1 MB by default. This amount can be configured when creating the thread.
When the Memory Manager allocates the stack, memory is initially only reserved, and it is later committed only when needed. To illustrate stack memory committing, in this example we allocate a static array with different sizes in each case (1, 2, and 3).
// 1
const SIZE_T size = 100;
int Buffer[size];

// 2
const SIZE_T size = 100000;
int Buffer[size];

// 3
const SIZE_T size = 200000;
int Buffer[size];
We can observe how the committed memory size of the stack increases:
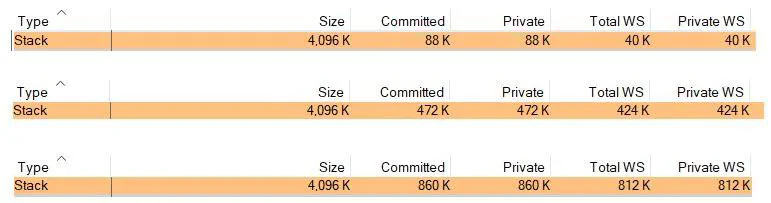
Stack committed memory grows only when needed.
When you allocate a thread dynamically at run time, its stack is also created at runtime.
Query stack memory. To determine if a specific virtual address is in the
stack, you can start by checking if the address is MEM_PRIVATE (refer to
private memory above). If it is the case, you can then collect the base address
for each stack of each thread using Windows functions such as OpenThread and
GetThreadContext. Next, you can check whether it belongs to one of the thread’s
stacks.
Code available on GitHub: https://github.com/brmel/MemoryTracer
3 — Heap
Windows aligns each region of reserved process address space to begin on an integral boundary defined by the value of the system allocation granularity; this value is 64 KB.
Most applications allocate smaller blocks than the 64 KB minimum allocation
granularity possible using page-granularity functions such as VirtualAlloc.
Allocating such a large area for relatively small allocations is not optimal from
a memory usage and performance standpoint. To address this, Windows provides a
component called the heap manager, which manages allocations inside larger memory
areas reserved using the page-granularity memory-allocation functions. The
allocation granularity in the heap manager is relatively small: 8 bytes on 32-bit
systems, and 16 bytes on 64-bit systems. The heap manager has been designed to
optimize memory usage and performance in the case of these smaller allocations.
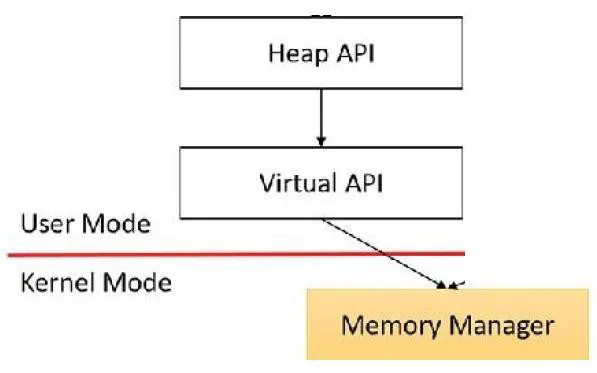
Heap API layer.
You can create many heaps for a process using the HeapCreate function, and you
can use the HeapWalk function to enumerate the allocated memory blocks in a
specified heap.
Note. I didn’t find an easy way to determine if a virtual address is in the heap, except by enumerating all heap blocks and checking if the specific address is within one of the blocks.
Example with C++ STL containers. When you call the reserve memory function
of a std::vector container, memory is both reserved and committed in the heap.
In this example, we can observe how both the reserve and resize functions
actually reserve and commit memory.
// 1
std::vector<int> Vector1;
Vector1.reserve(10);

// 2
std::vector<int> Vector2;
Vector2.reserve(10000000);

// 3
std::vector<int> Vector3;
Vector3.resize(10000000);
We can observe that both reserve and resize functions of a std::vector are
reserving and committing memory:
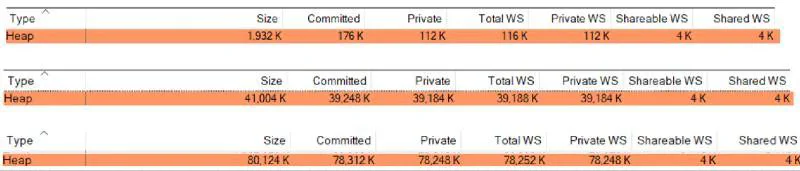
Both reserve and resize functions of std::vector commit memory.
4 — Mapped files
A mapped file is a file that has been mapped into virtual memory such that it looks like it has been loaded into memory. The operating system will then transparently load parts of the file into physical memory as the application accesses them, and release them again if not needed anymore. The API that is provided by Windows is called the File Mapping API, and it is the same API used to share memory between processes.
Raymond Chen said: don’t forget that
CreateFileMappingis used for creating both memory-mapped files and for creating plain old shared memory. The name of the function is misleading.
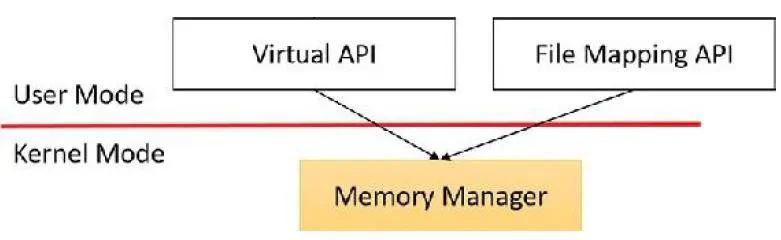
Windows memory management API layers.
Shared memory can be defined as memory that is visible to more than one process, or that is present in more than one process virtual address space.
The underlying primitives in the memory manager used to implement shared memory are called section objects. A section object can be connected to an open file on disk (called a mapped file) or to committed memory (to provide shared memory).
In this example I will use the File Mapping API to modify the content of this file:
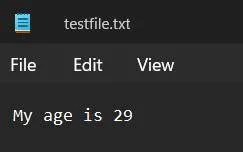
Text file before file memory mapping.
The algorithm steps are easy to follow:
HANDLE hFile = CreateFile(
    L"C:\\testfile.txt",          // File name
    GENERIC_READ | GENERIC_WRITE, // Desired access
    0,                            // Share mode (0 for no sharing)
    NULL,                         // Security attributes
    OPEN_ALWAYS,                  // Open existing or create new
    FILE_ATTRIBUTE_NORMAL,        // File attributes
    NULL                          // Template file
    );

// Get the size of the file
DWORD fileSize = GetFileSize(hFile, NULL);

// Create a file mapping object
HANDLE hMapping = CreateFileMapping(
    hFile,                     // File handle
    NULL,                      // Security attributes
    PAGE_READWRITE,            // Protection mode
    0,                         // High-order DWORD of the maximum size
    fileSize,                  // Low-order DWORD of the maximum size
    NULL                       // Name of the file mapping object
    );

// Map the file into memory
LPVOID pMappedData = MapViewOfFile(
    hMapping,                  // File mapping handle
    FILE_MAP_WRITE,            // Access mode (write)
    0,                         // High-order DWORD of the file offset
    0,                         // Low-order DWORD of the file offset
    fileSize                   // Number of bytes to map (entire file)
    );

// Modify the content in the memory-mapped file
char* pData = static_cast<char*>(pMappedData);
const char* newText = "My age is 30";
memcpy(pData, newText, strlen(newText));

// Unmap the file and clean up
UnmapViewOfFile(pMappedData);
CloseHandle(hMapping);
CloseHandle(hFile);
After running this code, the text file is successfully modified:
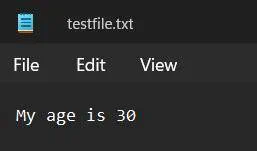
Text file after file memory mapping.
5 — Image
Images refer to DLLs and executables (.exe) that are loaded into memory. They
can be shared between processes. When an image is loaded, the memory space is
divided into many sub-regions with different protections (read, write, execute,
copy-on-write, and so on).
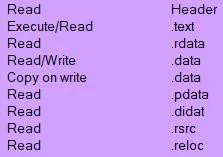
Memory sub-regions of a DLL loaded into a process virtual address space.
When the data of an image is intended to be shared between processes and cannot be modified, it is marked as read. If the data can be modified by a specific process, it is marked as copy-on-write.
In this example, page 2 is marked as copy-on-write. Therefore, when Process B wants to modify it, the memory manager creates a copy of page 2 accessed only by Process B and marks it as read-write.
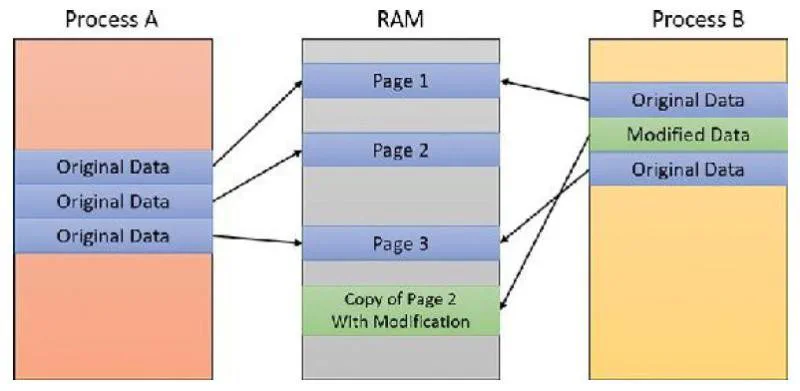
Pages marked as copy-on-write are copied only when modified by the process, to optimize memory.
A mystery. It remains unclear to me how to explain why certain pages of an image that are marked as read end up in the private working set and are effectively added to the private bytes counter. I couldn’t find a definitive answer to this question, even after consulting the book.

Memory pages of a DLL marked as private, even when they are marked as read-only.
6 — Unused regions
When allocating a block of memory, the specified allocation base address is rounded down to the nearest multiple of the allocation granularity, which is currently 64 KB on Windows. This results in some regions that cannot be used.
For 32-bit machines, unused regions caused a significant issue as an application could potentially run out of virtual memory due to memory fragmentation. However, for 64-bit machines this is no longer a concern, because the virtual memory space is very large — encompassing approximately 17.4 million terabytes of memory.
7 — Managed heap
Managed heap is memory allocated and managed by .NET’s garbage collector. It will not be discussed in this article.
Memory Tracer
I introduced in the previous article the Memory Tracer project, an open-source C++ library designed to assist you in monitoring the virtual memory of a specific process over time. It allows you to display data on the screen, export well-formatted data to a file, and provides control over the snapshot frequency.
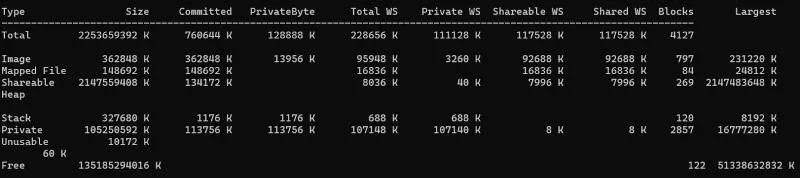
Memory Tracer showing the same results as VMMap.
Memory Tracer attempts to reproduce the exact results as VMMap. However, there is no guarantee of accuracy: VMMap appears to query virtual memory through interfaces that are not public, so the two will not always agree.
Future improvements:
- There is no heap tracing, so all data in the heap will be in the private data row. If you know an efficient way to traverse the heap and determine if a virtual address is within the heap, we can discuss it — because I am very curious.
- We should avoid allocating memory when taking a snapshot and exporting data, to prevent influencing the process being examined.
- There are some pages marked as private data in VMMap, but the reasons are
unclear. For instance, there are pages in DLLs with the
M_IMAGEflag and protectionM_READ, suggesting they should be shareable, but they appear as private.
If you have any suggestions, or just want to chat about memory or C++, please feel free to reach out to me.
Sources
- Mark Russinovich — Windows Internals, the book
- Microsoft — VMMap
- Microsoft — File Mapping API
- Microsoft — Creating Named Shared Memory
- Microsoft — .NET garbage collection fundamentals
- Raymond Chen — Why is address space allocation granularity 64KB?
- Raymond Chen — Trying to allocate the same virtual address in multiple processes
- Raymond Chen — Creating a shared memory block that can grow in size
- MemoryTracer on GitHub