Here is how hard it is to say how much memory a process is using: the people who build Windows have not agreed on it. Task Manager has labelled the same quantities differently across versions, and the Sysinternals team criticised one of those choices publicly.
I came to this from C++ and an electrical engineering background, where the question of what the hardware is actually doing is not academic. After Mark Russinovich’s talks on Virtual Memory and Physical Memory management in Windows I wanted two things: to be able to state the difference precisely, and to watch a process’s usage over time instead of sampling it in a tool. This article is the first; the tool at the end is the second.
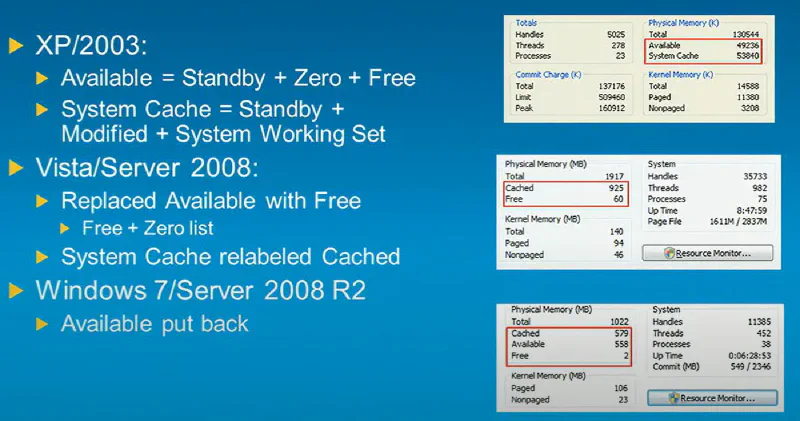
How Task Manager labelled memory across Windows versions.
Committed and reserved
Suppose you need to allocate a portion of memory on Windows. If you are using
C++, you can achieve this using the new keyword, for instance. Windows, if
possible, will then provide you with a pointer to the allocated memory that you
can use in your program.
The Memory Manager is responsible for handling this task, allowing you to specify certain characteristics of the allocated memory. For example, you can determine whether it should be committed immediately or reserved for future use.
Committed implies that the memory is ready for immediate use and is backed by physical memory (real hardware). On the other hand, reserved indicates that the memory is spoken for but not yet backed by anything physical; this memory is purely virtual.
Virtual and physical memory
Virtual and physical memory are important keywords. Let’s try to define them:
- Physical memory, often referred to as RAM (Random Access Memory), is the actual hardware component in a computer that stores data that is actively being used or processed by the CPU.
- Virtual memory refers to the address space that applications can use. In a 64-bit system, the virtual memory address space can theoretically address up to 2^64 (~17.4 million TB of memory). However, Windows 64-bit currently supports only ~16 TB.
This separation gives more flexibility to Windows and the Memory Manager. When Windows runs out of RAM, it uses your storage drive as extra space, allowing it to smoothly handle multiple tasks and big programs without getting overwhelmed.
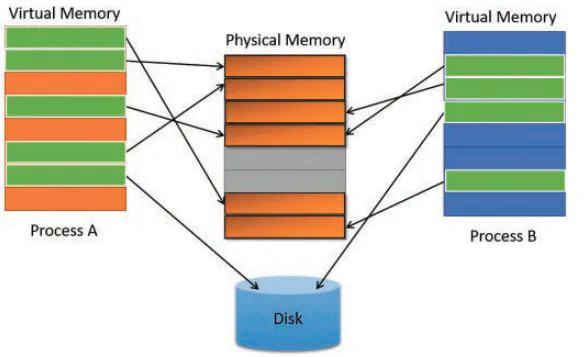
Virtual address space, mapped by the Memory Manager onto physical RAM and the page file.
Processes don’t have direct control over physical memory. The Memory Manager handles the mapping of virtual memory to physical memory and makes decisions about where to place data in physical RAM based on system demands and memory management policies.
Private and shared
The memory you allocate can also have many types, but most importantly, it can be private or shared. Private memory is accessed only by the owner process, while shared memory is like a common area where different processes can share and exchange information.
Windows offers highly useful tools for monitoring both virtual and physical memory through Sysinternals tools: VMMap for virtual memory and RAMMap for physical memory. These tools are easy to install and are thoroughly explained in the videos mentioned at the beginning of this article.
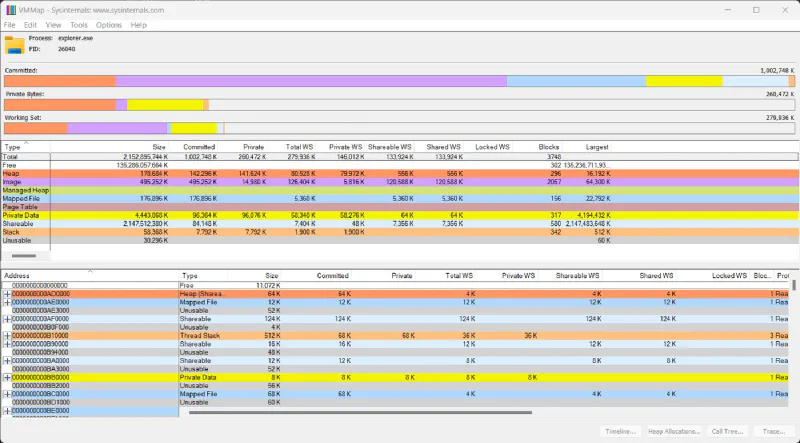
VMMap by Sysinternals.
In the next article, I will discuss in detail every memory type, and how they can be used in real applications, with examples. Your feedback and inputs are very welcome.
Debug virtual and physical memory usage
VMMap and RAMMap are excellent at what they do, which is capture the state of virtual and physical memory at one moment. What they are not built for is watching that state change: you cannot set the sampling interval, and getting the numbers out in a form you can plot is awkward. A leak that only shows up over an hour is invisible to a snapshot.
Introducing MemoryTracker
Memory Tracker is a C++ open-source project designed to assist you in monitoring the virtual memory of a specific process over time. It allows you to display data on the screen, export well-formatted data to a file, and provides control over the snapshot frequency.
You can integrate it into your code, utilizing it as a callback function to precisely control when to take a snapshot. Alternatively, you can employ it in another process if you prefer not to modify the code of the process you wish to track.
This is an example of tracking virtual memory usage of the process with id
32404:
// Process id you want to track
int Pid = 32404;

// Create MemoryTracker instance
CSnapshotMngr MyMemTracer(Pid);

// Specify the total duration and frequency, in seconds
int Duration = 120;
int PeriodT = 2;

// Export usage for 2 min by taking a snapshot each 2 seconds
MyMemTracer.Export(Duration, PeriodT);
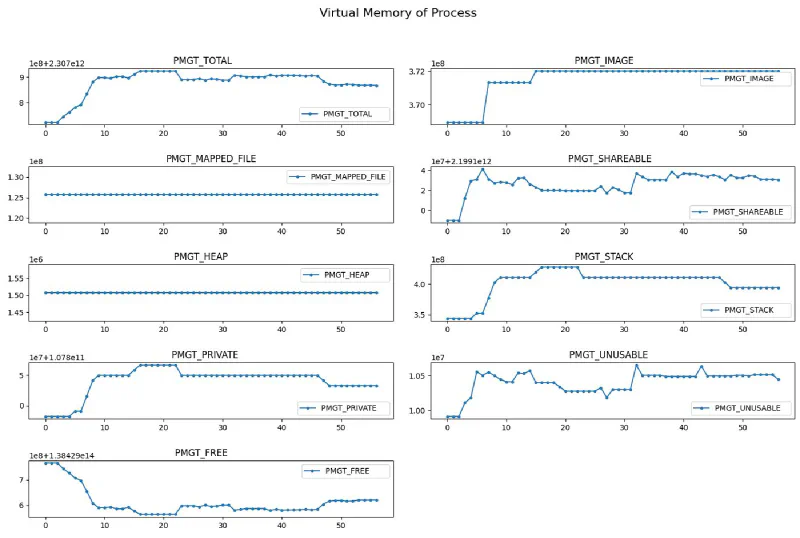
Virtual memory usage exported using MemoryTracker, regrouped by type.
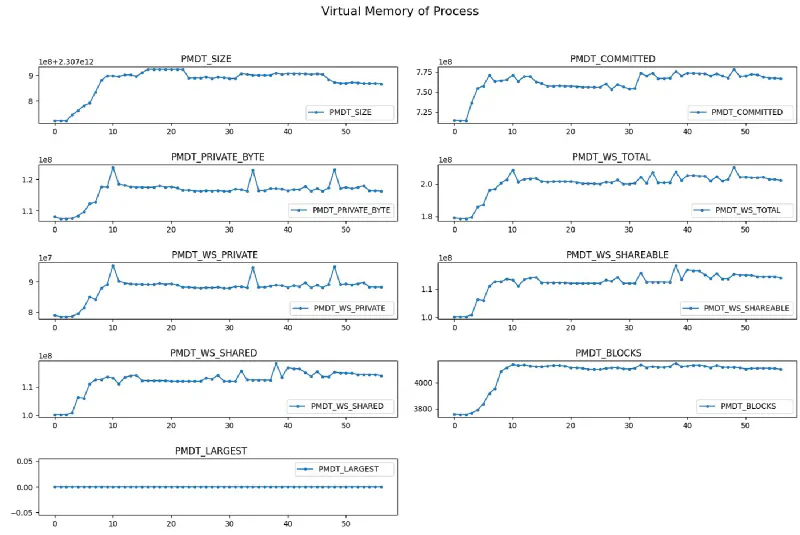
The same export over time — the view VMMap’s snapshots cannot give you.
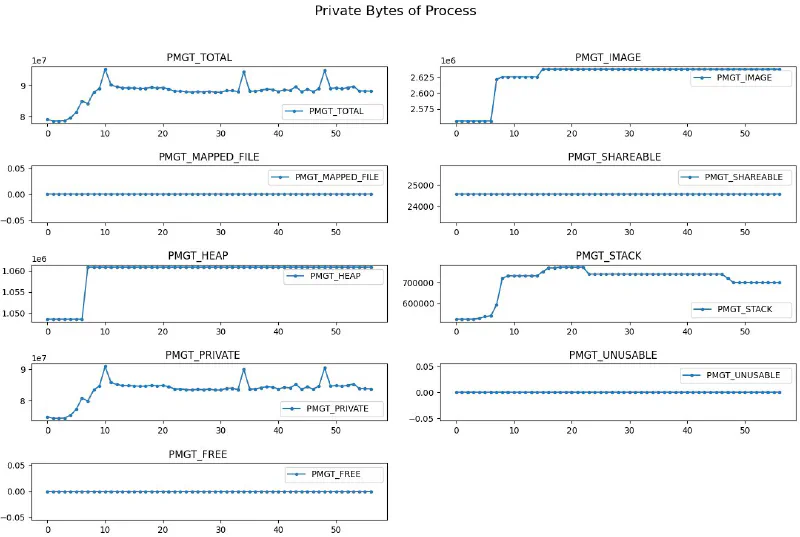
Private bytes of process usage exported using MemoryTracker, regrouped by memory type.
I am very open to all your feedback and inputs. Thank you!
— Brahim
Sources
- Mark Russinovich — Virtual Memory (video)
- Mark Russinovich — Physical Memory management in Windows (video)
- Microsoft — Sysinternals
- Microsoft — VMMap, the virtual memory map
- Microsoft — RAMMap, the physical memory map